SONAR Introduces the Accepted Truckload Volume Index: A New Standard for Freight Market Visibility
For years, freight market participants have relied on tender acceptance rates as a proxy for truckload market health. When carriers begin rejecting loads at higher rates, it typically signals tightening capacity and rising rates. When acceptance rates climb, the market softens. But there has always been a blind spot in this framework: while the industry could measure how much freight was being offered and how much was being turned away, there was no dedicated index that tracked the volume of freight that actually cleared the acceptance process and physically moved. SONAR's newly launched Accepted SONAR Truckload Volume Index (ASTVI) addresses that gap directly, offering the freight industry a cleaner, more actionable data signal than has ever been available before.
What Is the Accepted SONAR Truckload Volume Index?
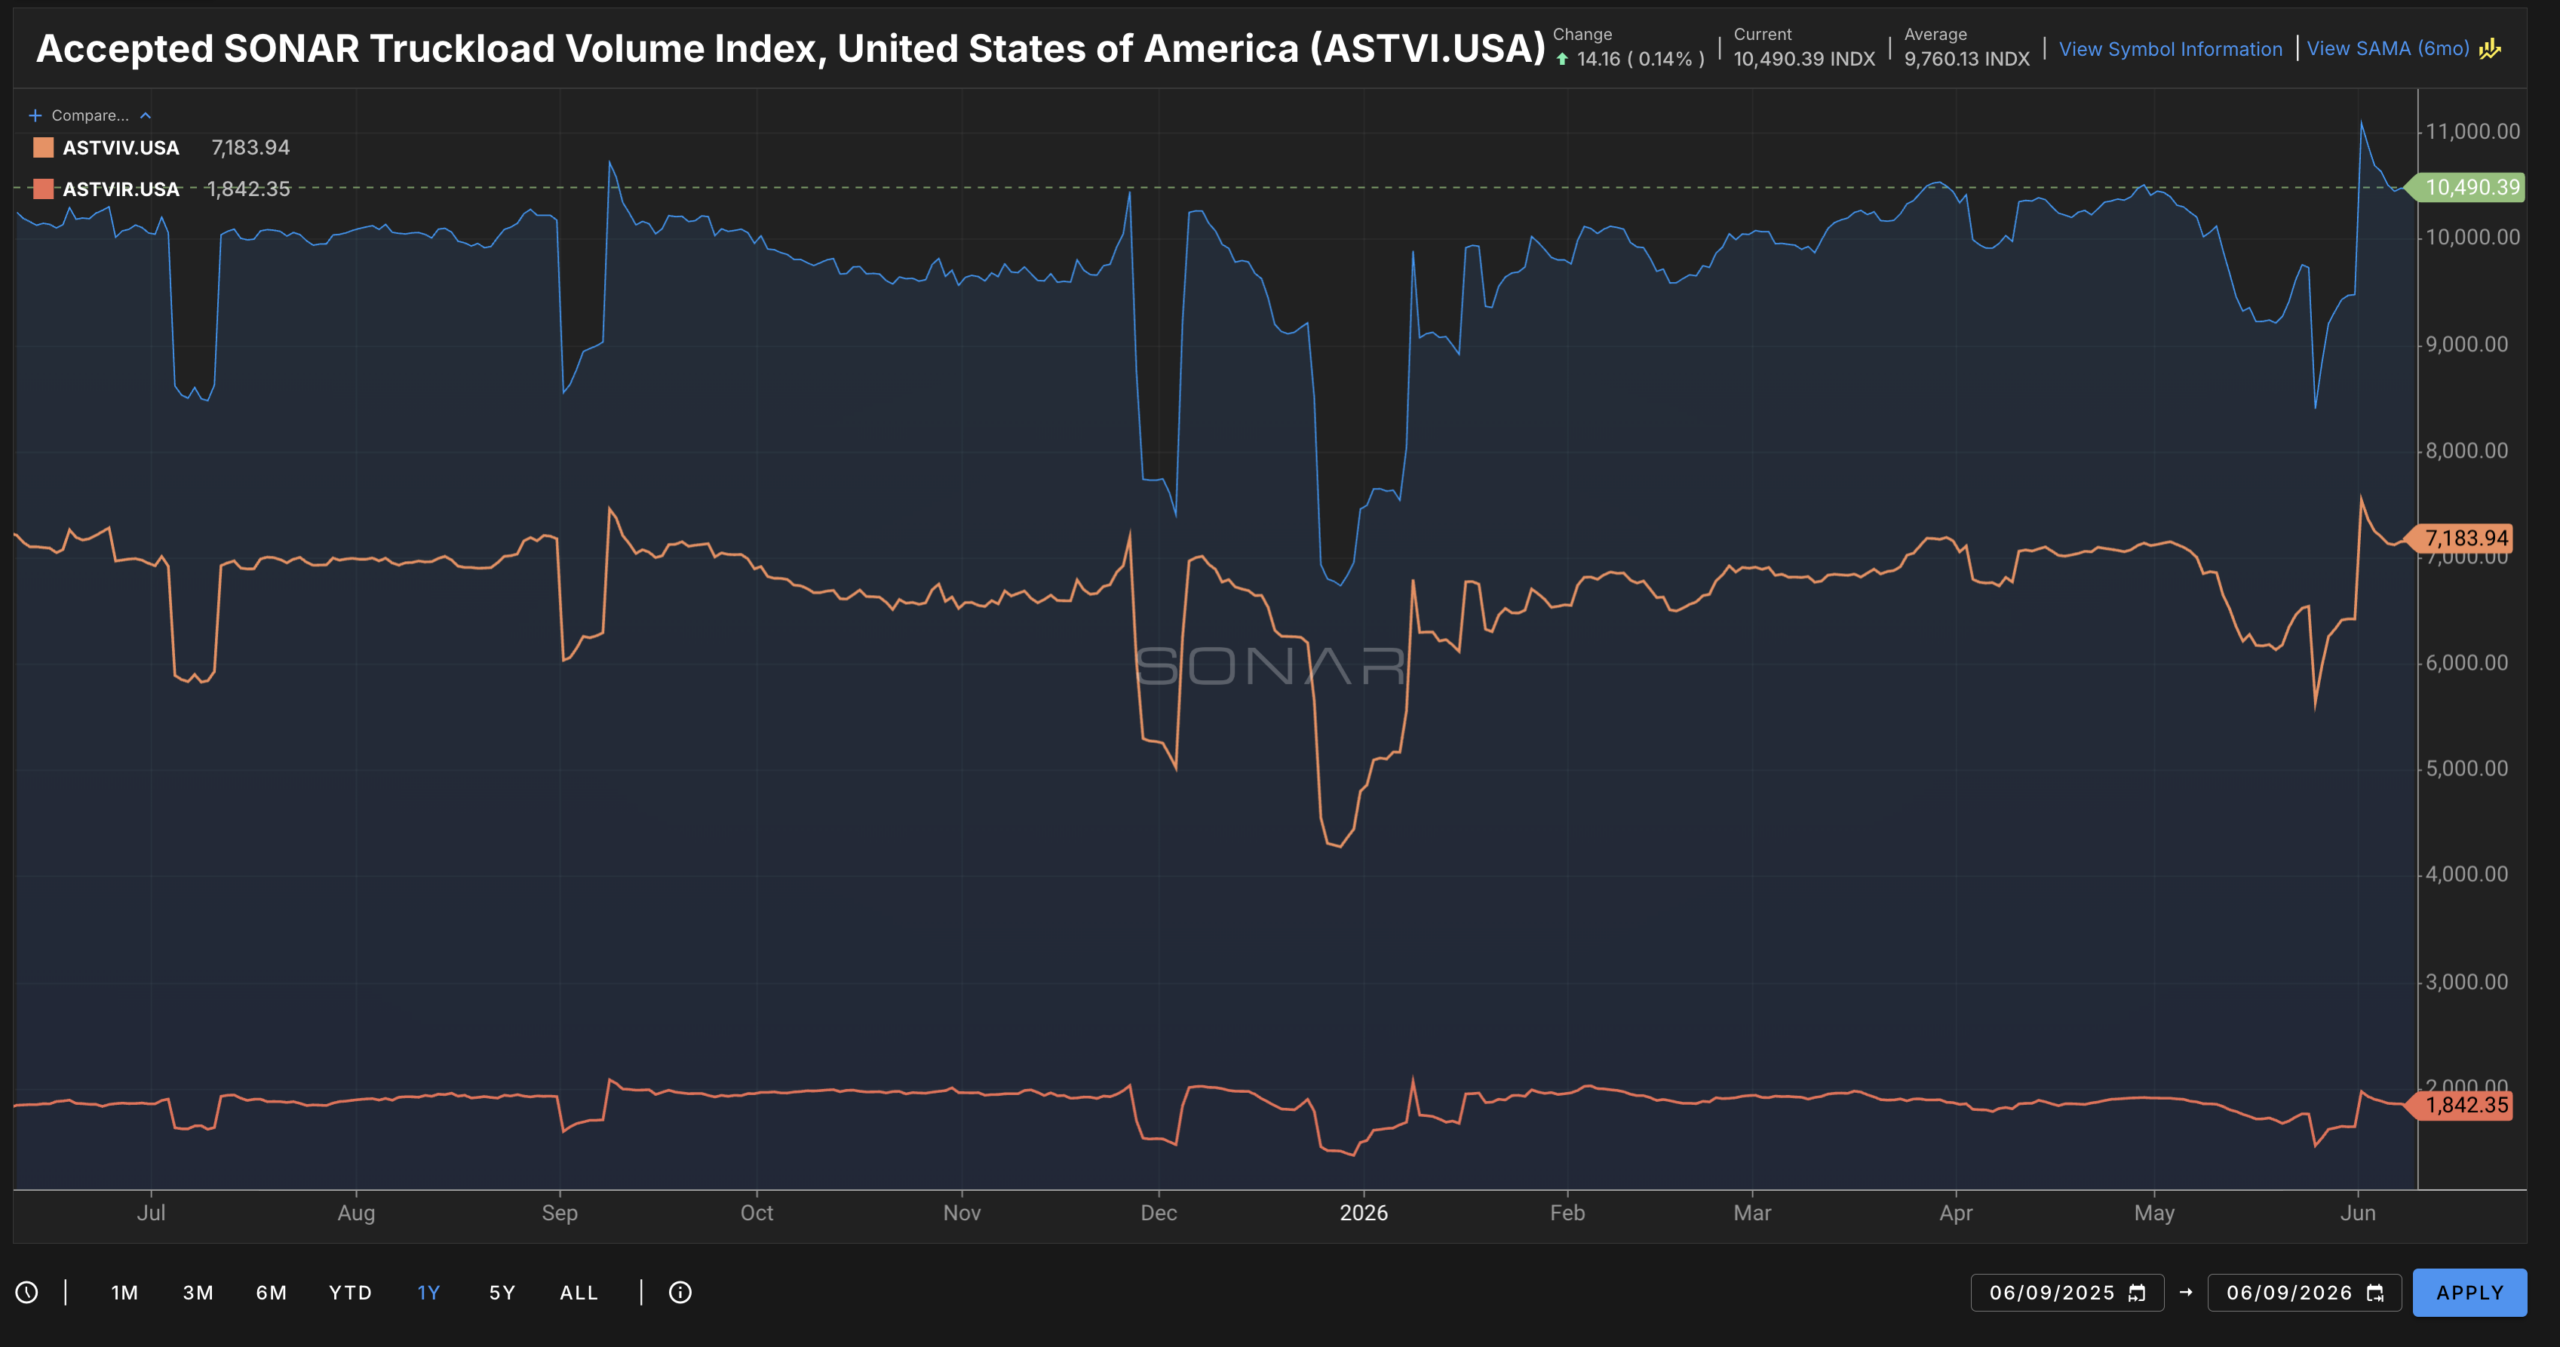
The Accepted SONAR Truckload Volume Index, or ASTVI, is a new dataset family built specifically to isolate accepted truckload demand from the broader stream of tendered freight activity. In practical terms, this means the index strips out all rejection activity and focuses exclusively on loads that were tendered to a carrier and confirmed — freight that is genuinely in motion rather than simply offered to the market.
This distinction matters more than it might initially appear. In traditional freight data analysis, total tender volume includes both accepted and rejected loads. When analysts want to understand true market flow, they have historically had to manually calculate the difference between tendered volume and rejection data — a cumbersome process prone to error and delay. ASTVI eliminates that friction by doing the math automatically, delivering a direct, pre-calculated view of what is actually moving.
The index is updated daily and is available at three geographic levels: national, regional, and individual market. It covers three freight segments: total accepted volume, dry van, and temperature-controlled reefer. For each of those segments, users can access week-over-week, month-over-month, and year-over-year change metrics, giving analysts a multi-dimensional picture of freight flow trends over time.
Why the Gap Between Tendered and Accepted Freight Matters
Understanding the spread between what shippers tender and what carriers actually accept is one of the most meaningful signals in truckload logistics. In a tight market, carriers hold significant leverage. They can afford to be selective, rejecting loads that don't meet their rate or lane requirements and waiting for better options. When that happens, the gap between tendered and accepted freight widens — and shippers who rely on their primary routing guides find themselves scrambling for backup coverage, often at premium rates.
In a soft market, the dynamics reverse. Carriers compete more aggressively for available loads, acceptance rates climb, and routing guides function closer to design. But even in these conditions, the spread between offered and accepted freight doesn't disappear entirely, and subtle shifts in that spread can serve as an early warning signal for changing market conditions.
Before ASTVI, quantifying this spread in real time required pulling data from multiple indices and reconciling them manually. That process introduced lag and complexity that reduced the value of the insight. With ASTVI, the calculation is embedded in the index itself, making it accessible to a much broader audience of users — including those who may not have the analytical bandwidth to run custom calculations on raw freight data.
Who Benefits from ASTVI?
SONAR's new index is designed to serve a wide range of stakeholders across the freight ecosystem, each of whom interacts with the tendered-versus-accepted dynamic differently.
- Shippers can use ASTVI to benchmark how effectively their freight is moving through the market relative to broader trends. If accepted volumes are declining at the national or regional level, it may indicate capacity tightening before rate increases materialize — giving procurement teams a head start on securing coverage.
- Carriers can leverage the index to identify where freight is genuinely moving and calibrate their fleet positioning accordingly. Markets with strong accepted volume relative to tendered volume may present more reliable load opportunities and better rate environments.
- Freight brokers stand to gain particularly clear value from ASTVI, as the index helps them understand the real supply-demand balance in any given market. Brokers who understand where acceptance gaps are widening can identify opportunities to provide spot capacity solutions and price them more precisely.
- Analysts and forecasters can incorporate ASTVI into macroeconomic and industry models that seek to understand freight market cycles. By providing a daily, granular, and pre-processed signal of actual freight movement, the index reduces the data preparation burden and improves model accuracy.
ASTVI in the Context of Soft Market Conditions
The timing of ASTVI's launch is notable. The truckload market has experienced extended softness, with carrier capacity outpacing freight demand through a prolonged correction cycle. In this environment, routing guide compliance has remained relatively high, but the details within that compliance picture tell a more nuanced story.
Even in soft markets, certain lanes, regions, and freight types experience tightness due to seasonal demand, weather disruptions, or regional economic activity. ASTVI's regional and market-level granularity makes it possible to detect these pockets of tightness even when national averages appear stable. That kind of precision is exactly what market participants need to make smarter procurement, pricing, and capacity decisions.
Furthermore, as the market eventually transitions back toward tightness — a cycle that freight analysts widely anticipate — ASTVI will become an even more critical leading indicator. Early shifts in the accepted-to-tendered ratio at the market level could provide weeks of advance notice before national rate indices begin to reflect the change.
How ASTVI Fits Into the Broader SONAR Ecosystem
SONAR has long been recognized as the freight industry's most comprehensive real-time data platform, offering indices that cover everything from tender volumes and outbound tender rejection rates to spot rates, contract rates, and equipment availability. ASTVI slots into this ecosystem as a logical complement to existing tender-side data, completing the picture of how freight moves from offer to execution.
Used alongside SONAR's Outbound Tender Volume Index (OTVI) and Outbound Tender Rejection Index (OTRI), ASTVI gives users a full three-part view of the tender lifecycle: what was offered, what was rejected, and what actually moved. That trifecta of data transforms what was previously a two-dimensional view of market activity into something far more complete and operationally useful.
The Bottom Line
The launch of the Accepted SONAR Truckload Volume Index represents a meaningful step forward in freight market transparency. By creating a dedicated, daily-updating index that tracks only the freight that clears the acceptance process, SONAR has eliminated a persistent data gap that forced analysts to work around missing information rather than with complete information. For shippers, carriers, brokers, and analysts who rely on data to drive decisions in a complex and cyclical market, ASTVI offers a cleaner signal, a faster workflow, and a more accurate foundation for understanding where the truckload market is truly headed.